Prometheus with Grafana: Monitoring a Application
In earlier post we discussed what is Prometheus and Grafana with its setup. Let’s talk about monitoring some servers, processes or any application.
Setup
I use MySQL as my database and the Apache web server to run a Django application. I have to keep an eye on both services’ traffic and load in order to take action to fix problems when they arise. It includes keeping an eye on our system.
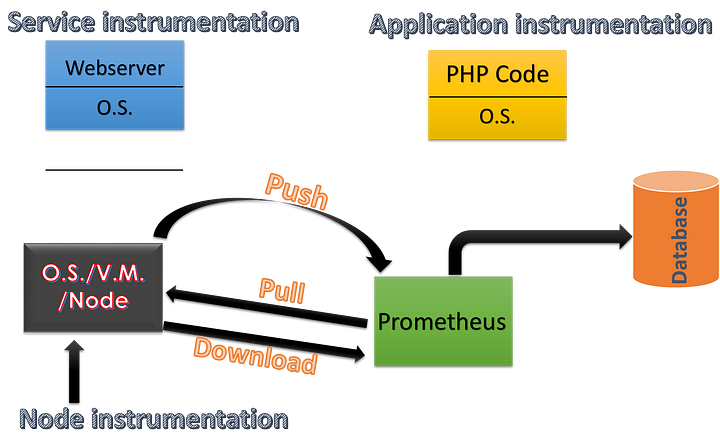
sudo apt-get install mysql-server apache2 -yTo do that we are going to setup Prometheus and we already know that it is an exporter based monitoring tool that means on target machine a exporter is installed that takes the target machine health and then Prometheus server pulls that data from exporter. These data are called Metrics. The pulling of metrics happens over HTTP then Prometheus server scrapes the metrics from web.
Here’s we are going to use multiple exporter namely
- Node exporter → It scrapes all the system metrics such as CPU, RAM, network, uptime and so on.
- MySQL exporter → It scrapes all the MySQL metrics such as max connection, threads, used connection and so on.
- Apache exporter → It scrapes metrics for Apache web server.
Why so many exporters?
Exporter just expose keywords that can be used in PromQL, So don’t be afraid.
From previous blog install node exporter and then install setup MySQL exporter and Apache exporter.
# Create user for mysql exporter
CREATE USER 'exporter'@'localhost' IDENTIFIED BY 'XXXXXXXX' WITH MAX_USER_CONNECTIONS 3;
GRANT PROCESS, REPLICATION CLIENT, SELECT ON *.* TO 'exporter'@'localhost';

wget https://github.com/prometheus/mysqld_exporter/releases/download/v0.15.0/mysqld_exporter-0.15.0.linux-amd64.tar.gz

tar xvzf mysqld_exporter-0.15.0.linux-amd64.tar.gz

cd mysqld_exporter-0.15.0.linux-amd64

sudo mv mysqld_exporter /usr/bin/

sudo mkdir -p /etc/mysqld_exporter

cd /etc/mysqld_exporter

cat > my.cnf
[client]
user = exporter
password = XXXXXXXX


cat <<EOF | sudo tee /etc/systemd/system/mysqld-exporter.service
[Unit]
Description=Prometheus Server
Documentation=https://prometheus.io/docs/introduction/overview/
After=network-online.target

[Service]
User=root
Group=root
Restart=on-failure
ExecStart=/usr/bin/mysql_exporter \
  --config.my-cnf=/etc/mysqld_exporter/my.cnf

[Install]
WantedBy=multi-user.target
EOF

sudo systemctl daemon-reload
sudo systemctl enable mysqld-exporter.service
sudo systemctl start mysqld-exporter.service

# it starts at port 9104
# curl http://localhost:9104/metrics

wget https://github.com/Lusitaniae/apache_exporter/releases/download/v1.0.2/apache_exporter-1.0.2.linux-amd64.tar.gz
tar xvzf apache_exporter-1.0.2.linux-amd64.tar.gz
cd apache_exporter-1.0.2.linux-amd64

sudo useradd apache -g apache
sudo groupadd --system apache
chown apache:apache apache_exporter
sudo mv apache_exporter /usr/bin

cat <<EOF | sudo tee /etc/systemd/system/apache-exporter.service
[Unit]
Description=Apache Server Exporter
Documentation=https://github.com/Lusitaniae/apache_exporter
After=network-online.target

[Service]
User=apache
Group=apache
Restart=on-failure
ExecStart=/usr/bin/apache_exporter

[Install]
WantedBy=multi-user.target
EOF
sudo systemctl daemon-reload
sudo systemctl enable apache-exporter.service
sudo systemctl start apache-exporter.service

# it starts at port 9117
# curl http://localhost:9117/metrics
Update prometheus.yml
- job_name: Prometheus
  static_configs:
    - targets: ["localhost:9090","localhost:9100"] # node exposes metrics on 9100
- job_name: MySQL
  static_configs:
    - targets: ["localhost:9104"] # mysql exposes metrics on 9100
- job_name: Apache server
  static_configs:
    - targets: ["localhost:9117"] # apache exposes metrics on 9117
Setup Grafana
Grafana provides the ability to visualize the metrics scrapped by Prometheus via graph, charts and so many other options. It also provides alerting features based on metrics.
mysql> CREATE USER 'grafana'@'localhost' identified by 'grafana@password';
mysql> create database grafana;
mysql> grant all privileges on grafana.* to 'grafana'@'localhost';
mysql> flush privileges;

# https://grafana.com/docs/grafana/latest/setup-grafana/installation/
# go to above link for another OS
sudo apt-get install -y apt-transport-https software-properties-common wget
sudo mkdir -p /etc/apt/keyrings/
wget -q -O - https://apt.grafana.com/gpg.key | gpg --dearmor | sudo tee /etc/apt/keyrings/grafana.gpg > /dev/null
echo "deb [signed-by=/etc/apt/keyrings/grafana.gpg] https://apt.grafana.com stable main" | sudo tee -a /etc/apt/sources.list.d/grafana.list
echo "deb [signed-by=/etc/apt/keyrings/grafana.gpg] https://apt.grafana.com beta main" | sudo tee -a /etc/apt/sources.list.d/grafana.list
# Updates the list of available packages
sudo apt-get update
# Installs the latest OSS release:
sudo apt-get install grafana -y

sudo vim /etc/grafana/grafana.ini
# search for database setting and replace the current with below one
[database]
type = mysql
host = 127.0.0.1:3306
name = grafana # database name
user = grafana
password = grafana@password


sudo systemctl daemon-reload
sudo systemctl enable grafana-server
sudo systemctl start grafana-server
Grafana Dashboards(Screenshot attached in earlier post)
- login to http://localhost:3000/
- user → admin password → admin
- create a new password
- from left panel select Data Sources → New connection
- Select Prometheus as data source and just enter the host(http://localhost:9090) then click on SAVE & TEST button
- Again click on hamburger Icon and open left panel then click on Dashboard.
Import Grafana Dashboards
The best thing about Grafana is it has already list of dashboards on its official site made by amazing guys for different type of data sources and exporters. Grafana has a option to import already built dashboards present at Grafana official site.
Search for dashboard related to your need and just copy the ID of the same.


- click on load

- Click on Import and then a beautiful dashboard would get created

- datasource sets to default (prometheus)
- Job shows prometheus. This is mentioned in prometheus.yml
- host show targets mentioned in prometheus.yml
- As you can see there are lots of panel in each dropdown.
- I can say this is the best way to learn the query language too. Open any panel and try to see the query that is used to get the data. This way you will explore a lots of function, keywords and so on.
Similarly if you import dashboard with ID 7362 for MySQL

- Try to import the existing one and change the queries according to your need.
- Similarly I imported Apache Dashboard with ID 3894
You know the best thing about these panels in dashboard you can copy it and paste it in another dashboard.


You can paste the panel in other dashboard.
I’m going to show you my application’s dashboard containing a sum of panels from all above dashboards.

If you click on panel’s menu then inspect, you will find the query used in that panel, panel’s json and other option too.
In queries binary and conditional operators can be implemented where PromQL already has a lots of predefined functions just like MS-Excel.
Custom Exporter
Sometime we need to monitor something that we want and should be in our control. Prometheus provide libraries for most the languages out there. So, I used Python to create one
from prometheus_client import start_http_server, Gauge, REGISTRY, GC_COLLECTOR, PLATFORM_COLLECTOR, PROCESS_COLLECTOR
import time
import psutil

firefox_memory_percentage = Gauge("firefox_memory_percentage", "Firefox Memory percentage")

def unregister():
    REGISTRY.unregister(GC_COLLECTOR)
    REGISTRY.unregister(PLATFORM_COLLECTOR)
    REGISTRY.unregister(PROCESS_COLLECTOR)

def process_request(t):
    for process in psutil.process_iter():
        if 'firefox' in process.name():
            print(process.memory_percent())
            firefox_memory_percentage.set(process.memory_percent())
    time.sleep(t)


if __name__ == '__main__':
    start_http_server(8888) # it exports the metrics on localhost:8888/
    unregister()
    while True:
        process_request(15)
It exposes the metrics on http://localhost:8888/ (not on /metrics)

Update prometheus.yml
- job_name: Custom Exporter
  metrics_path: "/"
  static_configs:
    - targets: ["localhost:8888"]
Summary
We learned about exporters, how to configure Prometheus config file according to it, importing Grafana dashboards & updating it according to need and finally creating our own exporter and monitor it through Grafana dashboard.
Next Part
Thanks for reading!!!
